5D - The truncus function
|
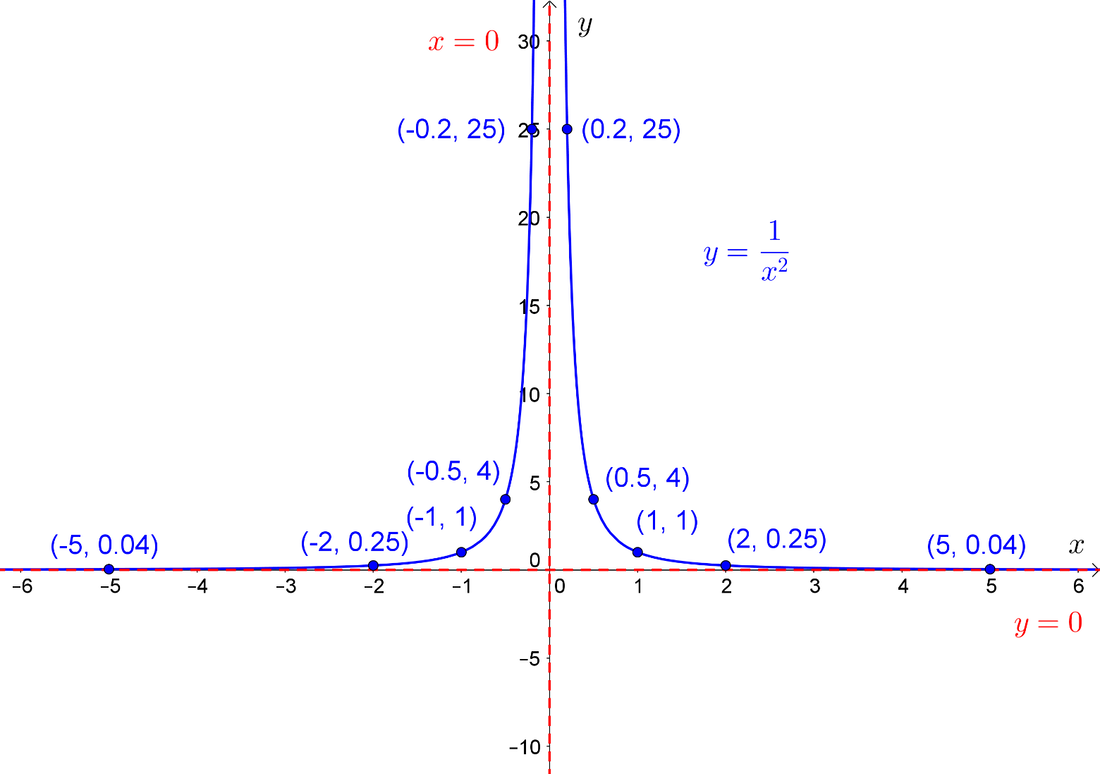
The truncus function has the general form: \[y=\frac{a}{(x-h)^2}+k\]
|
|
Graphing the truncus function:
When graphing the truncus function you must include:
When graphing the truncus function you must include:
- The basic shape of the graph which should appear to approach the asymptotes.
- Any axial intercepts which should be labelled with their coordinates.
- The asymptotes which are ruled with a dotted line and labelled with their respective equations.
5D - Example 1: Graphing the truncus function
|
Graph the following truncus and state the maximal domain and range: \[y=\frac{1}{(x-2)^2}+1\]
|
5D - Example 1: Video solution
5D - Example 1: Practice
Question 1: ABC Question 2: ABC 5D - Example 1: Solutions
Question 1: ABC Question 2: ABC |
5D - Example 2: Graphing the truncus function
|
Graph the following truncus and state the maximal domain and range: \[y=\frac{-2}{(x-5)^2}-3\]
|
5D - Example 2: Video solution
5D - Example 2: Practice
Question 1: ABC Question 2: ABC 5D - Example 2: Solutions
Question 1: ABC Question 2: ABC |
5D - Example 3: Graphing the truncus function
|
Graph the following truncus and state the maximal domain and range: \[y=\frac{1}{2(x+1)^2}-1\]
|
5D - Example 3: Video solution
5D - Example 3: Practice
Question 1: ABC Question 2: ABC 5D - Example 3: Solutions
Question 1: ABC Question 2: ABC |
