5C - The hyperbola function
|
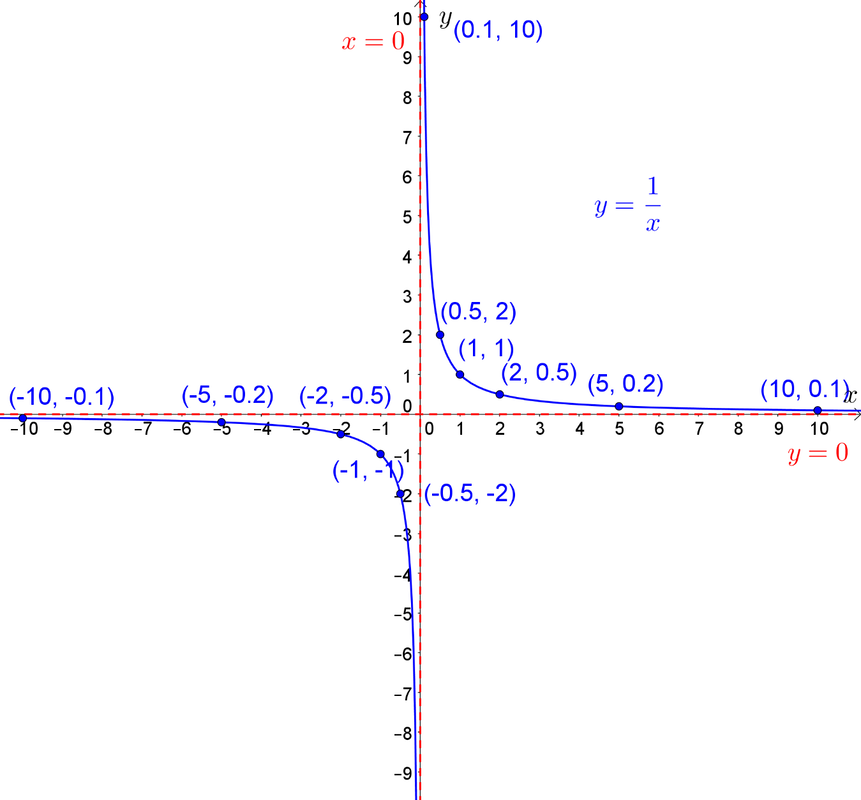
The hyperbola function has the general form: \[y=\frac{a}{x-h}+k\]
The hyperbola graph has two asymptotes. An asymptote is a line (or curve) where the distance between the function and the asymptote approaches zero as they tend towards infinity. In other words, the graph of the hyperbola will approach the horizontal and vertical asymptotes but never reach them.
|
|
The domain and range of a hyperbola:
In Section 6 we will explore the idea of domain and range in greater detail. For now we will give a brief introduction.
In Section 6 we will explore the idea of domain and range in greater detail. For now we will give a brief introduction.
- The domain is the set of all of the \(x\)-ordinates (or first elements in an ordered pair). For a hyperbola graph the maximal/implied domain is restricted by the denominator as it is unable to equal zero. Therefore, in general, the domain is given by \(x\neq h\). You should notice that this restriction corresponds to the vertical asymptote at \(x=h\).
- The range is the set of all of the \(y\)-ordinates (or second elements in an ordered pair). For a hyperbola graph the maximal/implied domain is restricted. In general, the domain is given by \(y\neq k\). You should notice that this restriction corresponds to the horizontal asymptote at \(y=k\).
Graphing the hyperbola function:
When graphing the hyperbola function you must include:
When graphing the hyperbola function you must include:
- The basic shape of the graph which should appear to approach the asymptotes.
- Any axial intercepts which should be labelled with their coordinates.
- The asymptotes which are ruled with a dotted line and labelled with their respective equations.
5C - Example 1: Graphing the hyperbola function
|
Graph the following hyperbola and state the maximal domain and range: \[y=\frac{1}{x-4}+5\]
|
5C - Example 1: Video solution
5C - Example 1: Practice
Question 1: ABC Question 2: ABC 5C - Example 1: Solutions
Question 1: ABC Question 2: ABC |
5C - Example 2: Graphing the hyperbola function
|
3Graph the following hyperbola and state the maximal domain and range: \[y=\frac{2}{3x+3}-1\]
|
5C - Example 2: Video solution
5C - Example 2: Practice
Question 1: ABC Question 2: ABC 5C - Example 2: Solutions
Question 1: ABC Question 2: ABC |
5C - Example 3: Graphing the hyperbola function
|
Graph the following hyperbola and state the maximal domain and range: \[y=\frac{1}{2-x}+2\]
|
5C - Example 3: Video solution
5C - Example 3: Practice
Question 1: ABC Question 2: ABC 5C - Example 3: Solutions
Question 1: ABC Question 2: ABC |
