13A - Analysing relationships
Relationships
Two variables are often linked by a relationship.
Two variables are often linked by a relationship.
- In some instances, there is a mathematical rule which describes the relationship.
- In other situations no such rule exists, instead we rely on data and observations.
13A - Example 1: Graphing the relationship between two variables
|
Water is being poured into each of the following containers at a constant rate. Draw a graph to represent how the height of the water changes as time progresses.
|
13A - Example 1: Video solution
13A - Example 1: Practice
Question 1: ABC Question 2: ABC 13A - Example 1: Solutions
Question 1: ABC Question 2: ABC |
Introduction to rates of change:
Rate of change can be defined as how one quantity (\(Q_1\)) changes in relation to another quantity (\(Q_2\)) changing. Mathematically this can be expressed as: \[ROC=\frac{\Delta Q_1}{\Delta Q_2}\] where \(\Delta\) is the "change in". It is important to remember that the rate of change is a quantity.
Rate of change can be defined as how one quantity (\(Q_1\)) changes in relation to another quantity (\(Q_2\)) changing. Mathematically this can be expressed as: \[ROC=\frac{\Delta Q_1}{\Delta Q_2}\] where \(\Delta\) is the "change in". It is important to remember that the rate of change is a quantity.
Qualitative description of rates of change:
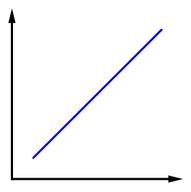
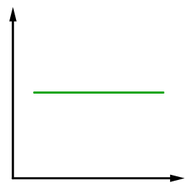
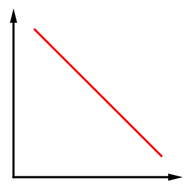
Rates of change can be positive, negative or zero:
Rates of change can be positive, negative or zero:
|
|
|
sRates of change can be constant or variables.
- A relationship with a constant rate is one where the rate of change of one quantity with respect to another does not change. This is characterised by a straight line. The three graphs above demonstrate constant rates of change.
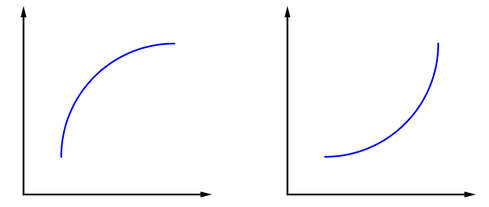
- A relationship with a variable rate is one where the rate of change of one quantity increases or decreases in the relationship. This is characterised by a curve (non-linear). The graphs below demonstrate variable rates of change.
Quantitative descriptions of rates of change:
We can describe the rate of change with a numerical value. Numerically, we can calculate the:
We can describe the rate of change with a numerical value. Numerically, we can calculate the:
